Here is a paper on the history of the polyconic projection: Mark Monmonier - Practical and Emblematic Roles of the American Polyconic Projection.
From the early beginnings:
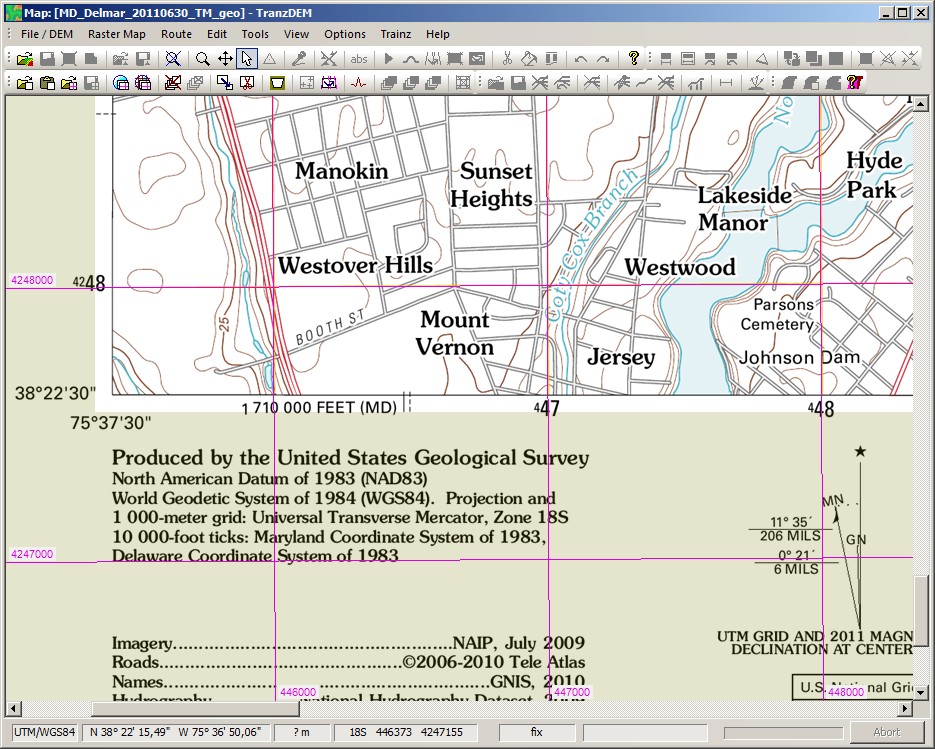
And still in use in the 1970s:
The paper also mentions field plots, where projection did not matter much at all, because of the large scale.
It reminds me a lot of the history of the Cassini/Soldner projection officially in use in Germany between the 1880s and late 1920s. While there are significant differences - Cassini/Soldner was not used as a local projection, but as one with a relatively large number of regional grid systems with central reference points - bureaucratic inertia played a role here, too. For ease of use the Cassini/Soldner system of Berlin (federal state) survived even until 2010.
From the early beginnings:
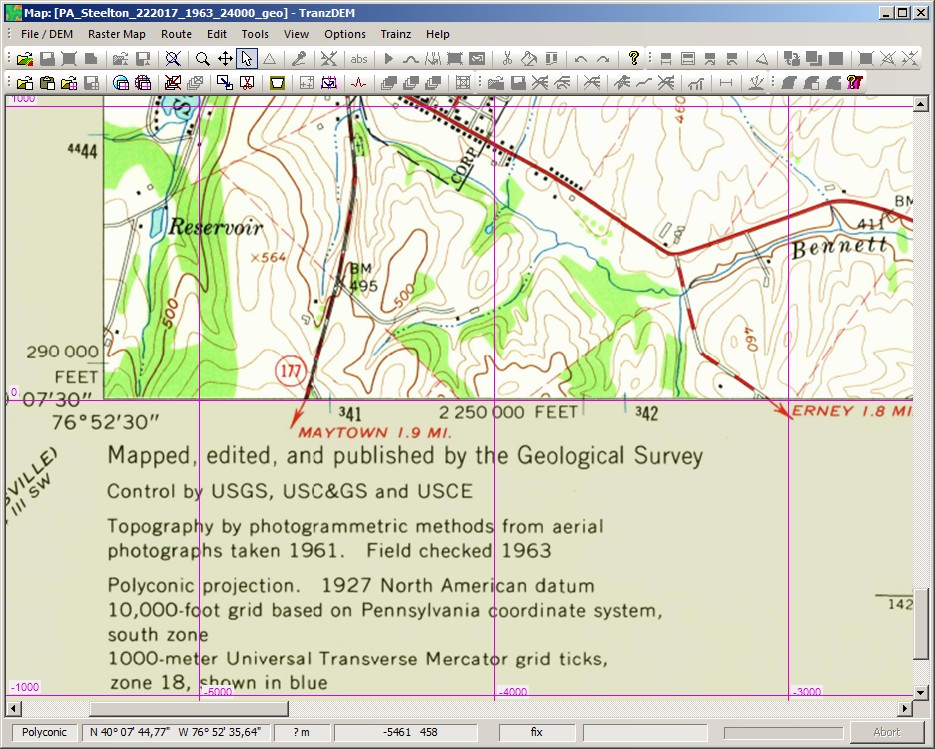
“In each of these sheets, it was intended to bring the
results of several parallels, so that the central meridian
alone should become a straight line, and all the other
meridians and parallels broken lines, nearest the curve,
to which they belong; the angular points of the trape-
zium being transferred to paper by their rectangular
ordinates, from the middle right angle, calculated from
the angle at the center of the projection, in the pro-
tracted axis of the earth” (HASSLER 1825, p. 407)
And still in use in the 1970s:
“Hydrographic survey data shall be plotted either on
the modified transverse Mercator or on a polyconic
projection. At the relatively large scales required for
hydrographic surveys, the two projections are essen-
tially equivalent and may be used interchangeably for
comparisons and transfer of hydrographic data” (UM-
BACH 1976, p. 1-6).
The paper also mentions field plots, where projection did not matter much at all, because of the large scale.
Simply put, the dis-
tortion associated with earth curvature can be far less
significant than the combined errors associated with
paper shrinkage, survey instrumentation, and manual
plotting.
It reminds me a lot of the history of the Cassini/Soldner projection officially in use in Germany between the 1880s and late 1920s. While there are significant differences - Cassini/Soldner was not used as a local projection, but as one with a relatively large number of regional grid systems with central reference points - bureaucratic inertia played a role here, too. For ease of use the Cassini/Soldner system of Berlin (federal state) survived even until 2010.
 :wave:


")
")