interpreting DEM data maps

martinvk

since 10 Aug 2002
For the longest time I was making maps without the benefit of DEM data to provide the elevation contours. Granted, most of my maps are Dutch based so I didn't have too many mountains to worry about.

After diving into the DEM pool, and working on my recent maps I have some observations I would like to share.

Here we see part of the Maasvlakte which is at the western end of the Europort, Rotterdam.
martinvk_20100711_0001.jpg


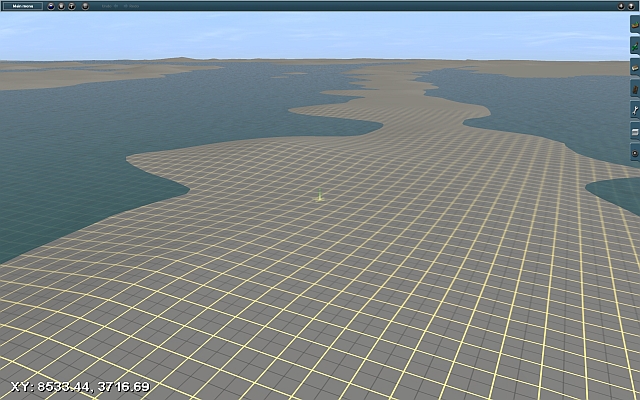
This is the same view with the water raised to highlight some the hills.
martinvk_20100711_0002.jpg


Now the Maasvlakte is a pretty flat area so I was wondering what the bumps could be.

Here is a view of the same area after some of the high voltage transmission towers were placed. Note that each one is located where one of the hills was made by the DEM data.
martinvk_20100711_0000.jpg

After studying Google Earth images, it would appear that buildings and even high voltage transmission towers leave their impression in the DEM data.

In other nearby areas, major bumps have turned out to be silos, power plants, warehouses, etc.

So the next time you look at the terrain made from DEM data, not all of those hills are really hills.
 
Hi Martin,

I too recently discovered the world of DEMs as well, and noticed this too. For me the landscape is a bit more bumpy so these features aren't as noticeable, but in my area there are scars on the earth left by highways. The interstate, which runs north of my house, shows up as a large curving grade. The railroad lines are barely visable on the DEM.

Now that you've pointed out the little bumps, I went back and looked again, and saw littel bumps along a string of hills. Knowing the area well, these are high-tension lines that cut through the woods and up on to a line of hills along the Merrimack River.

Interesting discovery, and thank you for pointing this out.

John
 
Transdem

Has Transdem changed then?
All the maps I use are full of vewry pretty colours yet those images are completely bare.
On my maps the power line poles are marked with an X (X marks the spot I guess!) so it is very easy to place them exactly.
All roads, rivers and track lines are also marked in red or blue while fields are a light yellow I think and areas where buildings should be placed are white.
So what has happened to these maps?

Another thing I discovered a long time ago is that when the map is 'rendered' the program attempts to make its own adjustments, don't ask me why, but it does, so a hill can get higher if it's near a deep cutting or gorge while flatter areas tend to get, well, flattened.

The last map I used was for the third section of my WCL series from Frome to Taunton so ran through some very hilly country and I had enormous problems with heights. This meant using the DEM in conjunction with an Ordnance Survey map of the area so I could check the correct heights at given points, especially along tracks.

However, better to have a DEM than not, and have to put that lot in by hand!

Thanks again John. for all your efforts, they were worthwhile,

Angela

Angela,

The colored lines and such come from county map information provided by the local municipalities. The information is then provided to the government bodies that handle the maps. Over here they are called TIGER maps.

I agree, it's beter to be better DEM'd than not. ;)

John
 
Topologically Integrated Geographic Encoding and Referencing system.

Developed by the US Census Bureau. These are the people that do the head count every 10 years so I guess they need something to keep them busy in between times.

Bob Pearson
 
Topologically Integrated Geographic Encoding and Referencing system.

Developed by the US Census Bureau. These are the people that do the head count every 10 years so I guess they need something to keep them busy in between times.
As Bob writes, a product created by the US Census Bureau, not by USGS, the US mapping agency. It was just by chance that TIGER maps made it into the Trainz world. The popular MicroDEM program by Prof Peter Guth happened to support TIGER vector data. That helped the HOG program which transfers and converts the data but does not offer geo mapping features in its own. Obviously, TIGER is only available for the US.

After studying Google Earth images, it would appear that buildings and even high voltage transmission towers leave their impression in the DEM data.

In other nearby areas, major bumps have turned out to be silos, power plants, warehouses, etc.

So the next time you look at the terrain made from DEM data, not all of those hills are really hills.

Yes and no. It depends on the DEM data source. For those of us outside North America we are blessed with SRTM and ASTER for the foreseeable future. Both are orbital DEMs and satellites have their difficulties in distinguishing forests and buildings from rock bed. Both SRTM and ASTER data undergoes some post-processing and the algorithms may improve from version to version but a bit of caution is always recommended.

Terrestrial DEMs like US NED or Canadian CDED do not have such artefacts. So for a US route, even if you stick to 1 arc sec to save memory, use NED, not SRTM. Over here in Europe there is not much choice. There is ViewfinderPanoramas, always worth a look, but since this is hand-made it introduces other types of error, e.g. occasional horizontal displacement.

For the UK TransDEM 2.1 will support O/S Land-Form Panorama, with is a terrestrial 50m DEM covering Britain.

Has Transdem changed then?
All the maps I use are full of vewry pretty colours yet those images are completely bare.
On my maps the power line poles are marked with an X (X marks the spot I guess!) so it is very easy to place them exactly.
All roads, rivers and track lines are also marked in red or blue while fields are a light yellow I think and areas where buildings should be placed are white.
TransDEM hasn't changed, but the map overlay is an option, both in TransDEM and in HOG. I guess that John Goddard is preparing the terrain for your route projects and I guess John is using the 1:50000 O/S topographic map for the overlay. These maps show a lot of detail, including power line poles.

Another thing I discovered a long time ago is that when the map is 'rendered' the program attempts to make its own adjustments, don't ask me why, but it does, so a hill can get higher if it's near a deep cutting or gorge while flatter areas tend to get, well, flattened.

The DEMs we get have limited horizontal resolution. Outside the US and Canada we mainly use SRTM 3 arc sec. For the UK 3 arc sec converts to 60 x 90 m, meaning you get an elevation every 60m east/west and every 90m north/south. This explains why the the valley bottom isn't deep enough or the hill top appears too low.

50m Land-form Panorama - see above - will help a bit here, but it won't bring sensational changes. In the US we have 1 arc sec as the basis (20 x 30m). There is also wide coverage in 1/3 arc sec (7 x 10m) and some areas are available in 1/9 arc sec, meaning you get an elevation every 3 m! And free of charge! (I will support 1/9 arc sec in TransDEM 2.1)
 
Back
Top