Install the app
How to install the app on iOS
Follow along with the video below to see how to install our site as a web app on your home screen.
Note: This feature may not be available in some browsers.
You are using an out of date browser. It may not display this or other websites correctly.
You should upgrade or use an alternative browser.
You should upgrade or use an alternative browser.
Question on setting track height
- Thread starter Jayco-man
- Start date
This depends a lot on what you are doing. If you are building a proto route set the spline heights at various points that are known then join them up with track sections.
On the other hand if it is not a proto route use the gradient tool then bring the terrain up to the track with the smooth spline point tool. There are not many places on most railroads where the gradient is more than 2%
Cheers,
Bill69
On the other hand if it is not a proto route use the gradient tool then bring the terrain up to the track with the smooth spline point tool. There are not many places on most railroads where the gradient is more than 2%
Cheers,
Bill69
cascaderailroad
New member
A gradient % is a ratio, the same in both metric and imperial scales ... no matter how long the track is (100' or 10,000' or 100m or 10,000m) the ratio is always the same
However the spline point height on a 2% grade 100' long is radically smaller numeral, than the spline point height numeral on a 2% gradient 10,000' long
Spline point heights are always displayed in metric in Trainz
When laying a gradient, the minimap oftentimes shows a totally different gradient numeral, than what the gradient actually is ... and you have to keep going backwards, and double re-checking, the several previous spline points, as the gradient numerals are off from what you typed in.
Example: When you type in 2% ... but the minimap shows 2.1% ... and when you apply several 2% gradients in a row, they are 2.1%, or greater.
In 5 miles of track, my newest route went up 239ft, (and was a total chore to keep going back re-checking the rear gradients continually) ... pretty steep !
In the track tab advanced there are 2 tool buttons ... one displays the gradient ... and the other displays the spline point height
There are 2 more tool buttons next to them that you can type in numeral ... the gradient numeral that you wish ... or the spline point height that you wish
Last edited:
Gradient equals Rise divided by Run, expressed as a percentage (ie, x100). So if you have a "Rise" of 10ft over a "Run" (distance) of 900ft, you would divide those to get 0.011111111111, multiply that by 100 to get your 1.1% grade. If you know you have a 1.02% grade over a distance if 750m, you would first divide the 1.02% by 100 (0.0102), and then multiply .0102 x 750, you know the height difference after 750m would be 7.65m higher than the original point.
Also, I believe spline point heights are displayed based on the "units" for the route unless something's changed - I haven't used "feet" in a long time because of the built-in rounding error in the program... On that note, I and many others always suggest you use metric when building routes, particularly prototypical ones, then after everything's said and done - just before you release it - switch back to imperial if it is an imperial route.
--- A reminder for our newer users - Trainz internally calculates everything based on meters but if you select imperial it calculates those to feet on-the-fly for displaying to the user, however it uses a horribly rounded calculation that will give you a huge measurable error over the course of miles or even just a few hundred feet... Use metric to build routes using an external conversion tool (Google has one - just type 750ft to m or 750m to ft) to get a much more accurate conversion. A lot of switching back and forth but much better in the long run.
When setting grades put in your percentage, click set spline height then click just beyond the first spline circle (Not in the center of the spline - it won't know which direction the grade should go. Also not in the center of the circle - again it won't know which spline you want to adjust and could go either way), it will set your second spline circle to the appropriate height based on the distance to it. If you have spline points very close together it does get tricky and often times you may end up setting the gradient in the wrong direction and have to go back to reset the previous grade and try again. I have never experienced Cascade's issue of having to go back many sections to reset the entire thing though... Only when I tend to screw up on close spline points as I mentioned.
Keep in mind you can also do negative numbers in the gradient box to go down from where you are. Also keep in mind that the HUD will always display the grade based on the "native" direction of the track (which many people claim doesn't exist, but that's the only way I can explain the HUD claiming I'm running on a negative grade when I know for a fact that I'm climbing...) so don't always believe the HUD to know if you're rising or falling.
cascaderailroad
New member
A gradient is oftentimes, if not always, a series of ups, downs and level trackage, combined with more ups, downs and level trackage, in order to get to the top of a grade ... it is a series of various leaps and dips

Last edited:
Well guys I guess the old saying, you have to be smarter than what your working with applies here, and I guess I'm not. I am totally lost with this part. I look to see if anyone done a video on u-tube, but cant find one. Would be nice if someone could do one. I am working on a proto and is Trans-Dem. I looked on the wiki and that is totally unhelpful as usual. I know you all are trying to help and I appreciate it very much. A video would be really helpful. Thanks for the help guys.:'(
I'm sure we're willing to help with the problem on your route. Perhaps you could give a different description of the problem, perhaps with a screenshot, perhaps with the explanation "This is where my construction so far ends, and this is where I want to get; how do I do that. Then we could give suggestions you might find more useful.
ns
ns
Ok I have all the info to build a route. Used Transdem and the info to build route and transfer it to Trainz. Now I want to start at one end and lay track to the other end using the track info I got from N&W Historical Society. What tool should I use, and how do I use it efficiently. Hope this helps.
OK, this helps, although it's not clear to me exactly what kind of data you got from the N&W HS. Whatever form the data is in, you should realize that there is some degree of discontinuity between the N&W HS data set, and what you find in TransDEM which is a result of the different techniques used to assemble the two data sets and different understandings because of the different times in which they were assembled. It may well be that the two sets of data differ so that what seems to be a particular distance on the information from N&W HS, is a slightly different distance on the data TransDEM obtained from the DEM servers.
If it were me, first thing I would do is to decide whether I'm interested in eventually extending the route from one or both ends. Next, study the track information, and compare it to the images you see on Google Earth, and your TransDEM maps. Particular places to look for: locations where the railroad crosses a river, and where the right of way sits in relation to other prominent landmarks, such as highway grade crossings. Find two locations close together where each of the locations has a height shown, and lay a segment of your desired track spline between the two points. Using the "use height" tool, set the height of each end of the spline to match the height on the track chart, then extend the track to the next point on the line for which you have a height, and set the height at the new spline point in the same manner.
If on part of the route there is a short branch line, make a copy of your route map, and use the short branch line as a testbed, where you can practice laying track and adjusting height.
ns
I will add that the height measured in Trainz on the TransDEM-generated route will be pretty close to what you measure on Google Earth. The difference maybe only a few meters here and there except for those places where the terrain gets munged due to close proximity of other hills and grades such as around highway overpasses and urban cuts. On the Hoosac Tunnel route for example, the difference measured near the East Portal entrance is only 3 meters. With this negligible difference it's not always necessary to adjust things unless you have to.
The places that will give you the most trouble will be junctions and yards where the tracks change from one height to another very quickly. The cause of this is our grid spacing between height differences when adjusting the terrain. Remember our resolution is much lower than what the USGS offers with their data so we have to compromise a bit because the track will float because of the short steep slope, and the close proximity of the diverging tracks. In places such as this, I use the crib wall fence and other retaining walls to fill in the terrain. This may or may not be prototypically 100% in these areas but it use looks better than floating track and roads.
John
You may have to take a two step process to get find the geographical co-ordinates in Trainz that you found in Google earth. Step one is to find the geographical co-ordinates of one corner of your route in TransDEM, then find the location with the same co-ordinates in Google Earth. Once you have linked matched the corner of the TransDEM map with the location in Google Earth, you should be able to navigate to the location you are seeking in Trainz; each 720 meters is one baseboard. Getting an altitude in Google Earth is as simple as getting the number off of the screen. In this screenshot
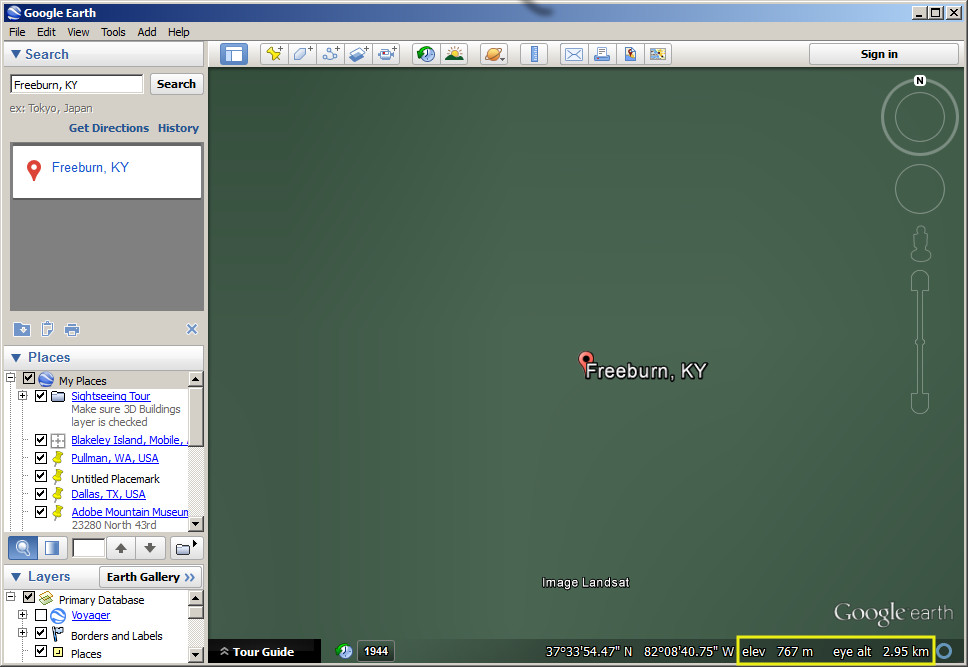
of a Google Earth view of Freeburn, KY the left most number in the yellow box in the lower right hand corner is the elevation of Freeburn (767 meters); the value of the "eye alt" right next to the value is the height at which the view was made, in this case 2950 meters, or about 15,000 feet. If the Google earth cursor is not over the viewport of the terrain, the altitude is of the marked entity; otherwise, if the Google earth cursor is over the terrain, the elevation value is that directly under the Google Earth cursor.
ns
Ok here is what I have on track chart. I have elevations base of rail showing base EL. of 200, and have figures showing starting at 668ft I guess it just shows the number and going up from there. Then I have grade numbers I guess showing numbers like this -0.045 not sure what kind of number it is. I have mile post markers. What would be the best way to set these to the map in Trainz? If I show grade numbers how would I show then in Trainz and what would be the best thing to use? I know I'm asking a lot of questions but I just don't want to do things Neely-wily and have to start all over. I thank it also has numbers to with the curves of the track, but I thank I can use my vector drawing ok. Hope this helps a little more. Thanks in advance.
cascaderailroad
New member
When you have a DEM, looking down from straight above, lay straight sections of track, so that they intersect ... take a ruler and measure back to @ where the track curves ... make sure that the 2 rulers are the same measurement ... as one may be different from the other ... this is a guestimate location of where a curve starts
Make your curves looking straight down from above ... months later when all your curves and straights look professional and prototypical ... sink all the spline points just under the surface (as trees, buildings, and schwubbery may have thrown off the actual height) ... you can fine tune the track spline points so that they just about show through ... this is your @ spline point height in meters
Never rush a job and immediately press the "Smooth Spline" tool button ... as if you use this tool prematurely, you will permanently deform your DEM ... making it trash !
Nothing is perfect on a DEM ... it may be dozens of feet off the actual terrain height ... due to errors in track tracings ... track may be down in river channels, or rivers way up on mountain sides ... you will just have to learn to cope with such inadequacies.
Any grade that is more that 1.75% or -1.75% is probably wrong, and needs to be ironed out
A grade may be level in one spot, and +0.25% the next, followed by a +0.50%, followed by a +0.75% then level again, then down -0.25%, then down 0.50%, then down 0.75%, then down -0.50%, then down 0.25%, then level again
A grade never goes radically up 75% from level, then suddenly down -1.75% to level
Sometimes a gradient may be easy and take only a nights work ... other times a 5 mile section may take a week to iron out perfect
Again: Never rush a job and immediately press the "Smooth Spline" tool button ... as if you use this tool prematurely, you will permanently deform your DEM ... making it trash ! Take months of running a route before hitting the "Smooth Spline" tool button
Last edited:
When you have a DEM, looking down from straight above, lay straight sections of track, so that they intersect ... take a ruler and measure back to @ where the track curves ... make sure that the 2 rulers are the same measurement ... as one may be different from the other ... this is a guestimate location of where a curve starts
Make your curves looking straight down from above ... months later when all your curves and straights look professional and prototypical ... sink all the spline points just under the surface (as trees, buildings, and schwubbery may have thrown off the actual height) ... you can fine tune the track spline points so that they just about show through ... this is your @ spline point height in meters
Never rush a job and immediately press the "Smooth Spline" tool button ... as if you use this tool prematurely, you will permanently deform your DEM ... making it trash !
Nothing is perfect on a DEM ... it may be dozens of feet off the actual terrain height ... due to errors in track tracings ... track may be down in river channels, or rivers way up on mountain sides ... you will just have to learn to cope with such inadequacies.
Any grade that is more that 1.75% or -1.75% is probably wrong, and needs to be ironed out
A grade may be level in one spot, and +0.25% the next, followed by a +0.50%, followed by a +0.75% then level again, then down -0.25%, then down 0.50%, then down 0.75%, then down -0.50%, then down 0.25%, then level again
A grade never goes radically up 75% from level, then suddenly down -1.75% to level
Sometimes a gradient may be easy and take only a nights work ... other times a 5 mile section may take a week to iron out perfect
Much of what you have said is true of the old HOG-generated routes such as placement of roads and tracks down in rivers, or way up mountain sides.
If he's using TransDEM, the height difference maybe as little as 2-5 meters, and the track location is usually spot-on where it should be. I have found that if I place a spline point at the beginning of a curve and at the apex of the curve on a TransDEM generated route, the tracks will conform exactly to the topomap image.
Where you run into problem, mostly, is in urban areas and in those where tracks run into cuts and against steep cliffs. This is due in part to the smoothing and rounding of the Trainz mesh as the grid is much courser than the actual DEM data. This can be partially corrected in TransDEM by fiddling with the resolution settings, but it doesn't always work because our results are only as good as can be generated by the original data.
I ran into this issue in my own city. Haverhill is on a few hills. The railroad runs next to Silver Hill, one of the tallest hills in the city. On the left is the hill, on the right is a railroad grade on an embankment, and farther to the right are factory buildings. The railroad grade gets smoothed out as it runs between the factories and the hills. In some locations, the roads underneath the tracks get munched as well and the embankment is level with the road.
As far as smoothing the terrain on a DEM goes, do this after the track has been locked into place and the grade is smoothed. With some of the newer track, such as the Protrack and other by Jointed Rail, there is no need to push the track into the terrain because it does not float or does so minimally there is no need for it. But do it after the track has been smoothed and the grades verified. There's no use in doing it the grade goes up 20% on one hill because you've messed up the measurement - been there and done that because I got lost on a bunch of curves! Do this afterwards because usually if you've done things right the first time, the track will show reasonable, less than 1% grades in most cases, so the terrain under the track can be raised using the smooth terrain button. That is not to say there aren't those places where there are sometimes short steep grades. If you have one on the track, verify on Google Earth by using the TransDEM image on the terrain as a reference to the location. If they prove true, put them in, otherwise figure out what's wrong, and sometimes due to the above mentioned anomalies, some things need to be adjusted. It's the nature of the beast with our less than high resolution grid.
Keep in mind, just as you said, the surface varies and in sometimes a tiny bit a few grid points away. This is due to anomalies in the terrain and the satellite readings of the ground. If we were to raise and lower the track for each and every spline point, we would have a seesaw and roller coaster of a ride, which is totally false. The image above looks like something that has been zoomed in which shows a bit more of an exaggeration of the grades. The area in fact could be Nebraska or western Kansas near the Colorado border.
What works well is to average the grade over a distance. Use key points, or a track chart if possible to get the height information for these points, and let the track run in height between these points. In the end the grade is smoother and more realistic, if not pretty accurate too. The key here is key points such as the beginning and end of a grade, the apex of a curve, the beginning and end of a curve, and so on. It takes a bit of trial and error the first time, but once you start measuring and doing, you'll find that it goes quickly and if things have to be redone because you've messed up a baseboard by trimming the wrong one out, it's a no brainer.

cascaderailroad
New member
Trainz measures in meters, so a measurement of 200 equals 656ft
OK. The top line, the diamonds, are the distance from the start of the subdivision. On this sheet I found on-line, the sheet starts at milepost 32 and extends to milepost 41. Immediately below the milemarker diamonds are the location of railroad owned buildings. In this case, they were the station at Ivanhoe and Catron Eagle, and a water tank at Will. The two lines immediately below the stations represent the rail. In the case of the sheet shown, the subdivision was abandoned, so there was no rail at the time the chart was made. Had there been rail present when the chart was made, the weight, year of manufacture, and year of installation would have been indicated with lines indicating the ends of each particular rail type. The next pair of lines represents ties and road bed work. In this chart, there had been roadbed or tie work from beyond mile post 34 to beyond mile post 35, and further in March of 1932, work between milepost 39 and 40, and work had been done from milepost 40 through the end of the sheet in August, 1931. The "square wave" line below that shows the curvature of the track. The horizontal line across the page represents tangent track, and looking across the line from left to right, areas above the line are curves to the right, while areas below the track represent curves to the right. From the left of the page, the line has a tangent section, then goes through an 8 degree curve to the left. The measurement of the curve is determined by taking the centerline of the tangent section before the curve, and the centerline of the tangent section beyond the curve, extending them until they cross, and measuring the angle. After the curve to the left, the track follows another short tangent section, and curves 6 degrees and 30 minutes to the right approaching the station.
The next two rows on the chart, the drawing, and the vertical printing below it are related. The drawing is the right of way, showing the location of various items that affect the roadway in the drawing, and the descriptions of those items in the printing below. From the left, the first item on the printed row is 0 + 0, and is an engineering method for designating the beginning, in this case, of the branch. The next two items to the right, "3 x 3 box", and "3 x 3.5 box" show the location, size and type of culverts through the roadbed for drainage. In this case, both are box culverts, 3 feet wide, with one 3 feet high, and the other 3 and one half feet high. The next item to the right, labeled "gr. cr." is a grade crossing of a hard surfaced county road crossing over the right of way on bridge 1651. Just to the right of that a short distance is another 3x3 box culvert.
The bottom set of drawings is the track profile. The base line elevation of the profile is shown in about the middle of the page, at the very bottom, as 1700 feet. The cross section of the right of way is shown by the jagged line above. At each significant point where there is a change in grade, the elevation is shown for the end points, so that at the very beginning of the branch, the actual elevation is 1995 feet; the next elevation to the right is 2005 feet and dividing the difference in elevation by the distance between the two points, one calculated the grade which is shown printed above the section of the track profile chart. The first section has a grade of .91 percent, or .91 feet of rise for 100 feet of run. Since the grade is .91, and the difference in height is 10 feet, one can determine that the distance between the two points by dividing the difference in elevation (10 feet) by the grade ratio (.91), and multiplying by 100 (since the grade is a percentage), gives the distance between these two points as about 1100 feet. A negative grade ratio indicates that the segment is going down hill.
Hope this helps.
ns
cascaderailroad
New member
My ... That's allot or wurds' ... just to lay track
I can help you lay track ... it's not all that hard
Contact me on Skype UN :cascaderailroad
I can help you lay track ... it's not all that hard
Contact me on Skype UN :cascaderailroad
Similar threads
- Replies
- 11
- Views
- 699
- Replies
- 5
- Views
- 826
- Replies
- 1
- Views
- 225
- Replies
- 6
- Views
- 806