Making sense of the alignment data in track charts

Blutorse4792

Now T:ANE I can get into
Below are two snippets from an old track chart, specifying the width and alignment (or rather, the "alinement") of the right-of-way:

alinement2.jpg

alinement1.jpg


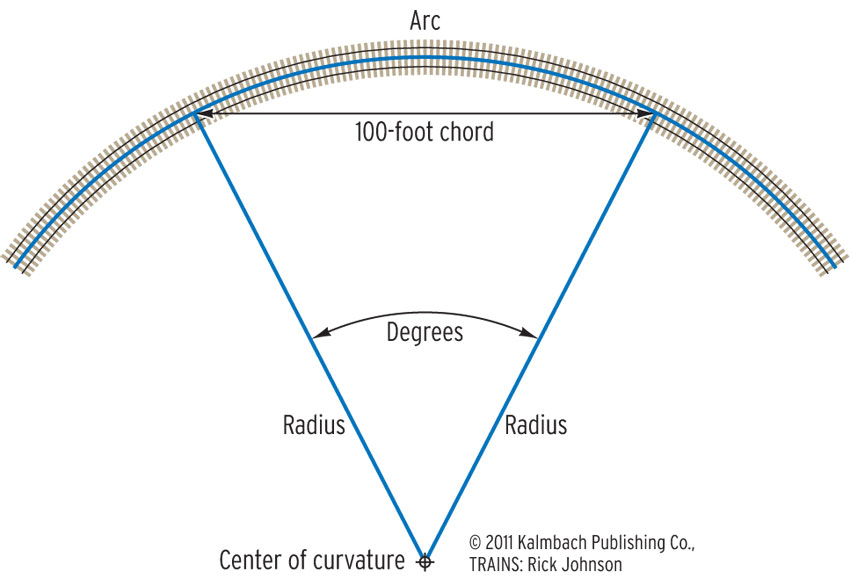
The listed widths are fairly self-explanatory, but I'm at a bit of a loss as to how to interpret those curvature/radii measurements... Mathematics were never my favorite subject in school, you see 🫠

Are there any resident geometry buffs who might be so kind as to help me make some sense of this?

Thank you!
 
So after several weeks of research, it seems that I may have been seriously overthinking this.

Apparently, railroad curve measurements are (or at least were) based on 100' chords, and I think that the angles noted in these charts represent the angle of deflection. So... Using the track chart, let's say I measure a right-hand curve with an actual length of ~500' and an angle of 1°. I can then use the ruler tool and, from the start of the curve, draw five 100' long segments, each 1° to the right of the last, giving me my curve and my second endpoint.

I could be way off-base here, but the results I've gotten so far look pretty close to what I'm seeing in old aerial photographs.
 
Last edited:
On the newer charts I have (various North American railroads), the curvature is given in degree. The number indicates how sharp a curve is, with a higher number meaning a sharper curve.

"... angles noted in these charts represent the angle of deflection" over the section spanned by the 100 foot chain.

There also is an approximation method, using a 62 feet chain, and then measuring the distance between the track and the chain at the center of the chain. In inches, this distance corresponds approximately to the degree of curvature.

 
On the newer charts I have (various North American railroads), the curvature is given in degree. The number indicates how sharp a curve is, with a higher number meaning a sharper curve.
I've been relying on some old American charts from the 1930s for my current project. While most curves are noted in degrees/minutes/seconds, there is at least one 90° curve (yes, really!) which instead has its radius noted in feet.

"... angles noted in these charts represent the angle of deflection" over the section spanned by the 100 foot chain.
This seems to be more-or-less exactly what I based my 100' ruler segment method on, so I think I'm finally on the right track here. The curves I've laid down thus far are lining up quite nicely with what I can discern from old photographs and aerials (though I'm discovering that the focal length of a camera lens can seriously distort and exaggerate their appearance from the ground level).
 
Last edited:
Back
Top